
Reading Time: 5 minutes
Hello AI Enthusiast,
Today we're tackling one of the most time-consuming tasks in professional life: report writing. Whether you're summarizing quarterly performance, analyzing market trends, or documenting project outcomes, we'll show you how AI can transform hours of drafting and formatting into a streamlined process that produces clear, well-structured reports.
The Problem
Report writing hits everyone differently. Marketing managers turning campaign data into stories, project managers consolidating updates, HR extracting survey insights. The challenge is universal: you know the story, but structuring it for stakeholders feels overwhelming, especially under deadline pressure.
How We Do It: A Step-by-Step Guide
Let's walk through creating a quarterly marketing performance report that actually gets read and acted upon. We'll use a hypothetical example to show you how to go from scattered data and notes to a polished document. For this process, we'll work with ChatGPT's Canvas feature since it keeps your evolving document visible in a side panel while you build it. You can select any text and ask for improvements without losing track of your progress.
Step 1: Build Your Report Structure
Start by uploading your data files to ChatGPT - spreadsheets, notes, whatever messy information you have, then ask ChatGPT to create your structure in Canvas:
Prompt:
Create a quarterly marketing performance report structure in Canvas for executive leadership. Based on the data I've provided, build a comprehensive outline that tells a clear story. The report should: - Start with key findings that matter most to executives - Present data in logical flow that builds to actionable recommendations - Include sections for performance metrics, campaign analysis, budget utilization, and next quarter priorities - Be designed for 15-minute executive consumption - Focus on business impact over marketing jargon Provide: 1. Detailed outline with section headers and bullet points for each section 2. Narrative flow between sections 3. Suggestions for which data points should be highlighted vs. relegated to appendices
Template version:
Create a [report type] structure in Canvas for [audience]. Cover [key topics] and design for [time constraint]. Focus on [primary concern]. Provide outline with section headers, narrative flow, and data prioritization.
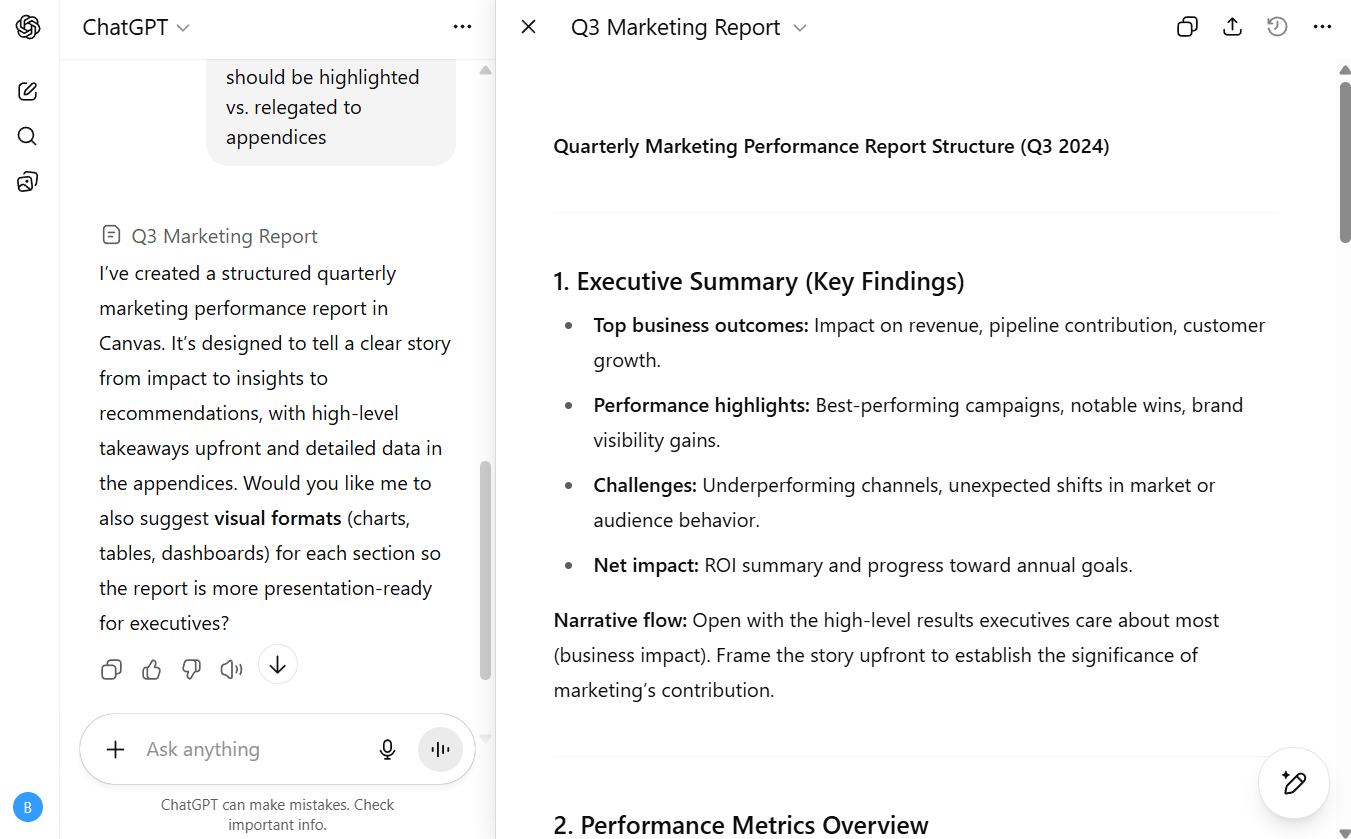
Structured report outline in ChatGPT Canvas
ChatGPT builds this as an actual document in Canvas where you can see everything laid out. It's pretty satisfying to go from "where do I even start" to having a real framework in about 30 seconds.
Step 2: Write Each Section Systematically
Now fill in each section one by one. This keeps the AI focused and gives you better results than trying to write everything at once.
Work through each section using targeted prompts that reference your established structure:
Prompt (for Performance Metrics section):
In our Canvas document, write the "Performance Metrics" section using the Q3 data I uploaded. Present this clearly for executives who understand business but aren't deep in marketing metrics. Structure this section to: - Lead with the most important metric - Show key comparisons to last quarter and last year - Highlight significant changes, both positive and negative - Use bullet points for easy scanning - Focus on metrics that tie to business outcomes Add this content directly under the Performance Metrics heading in Canvas.
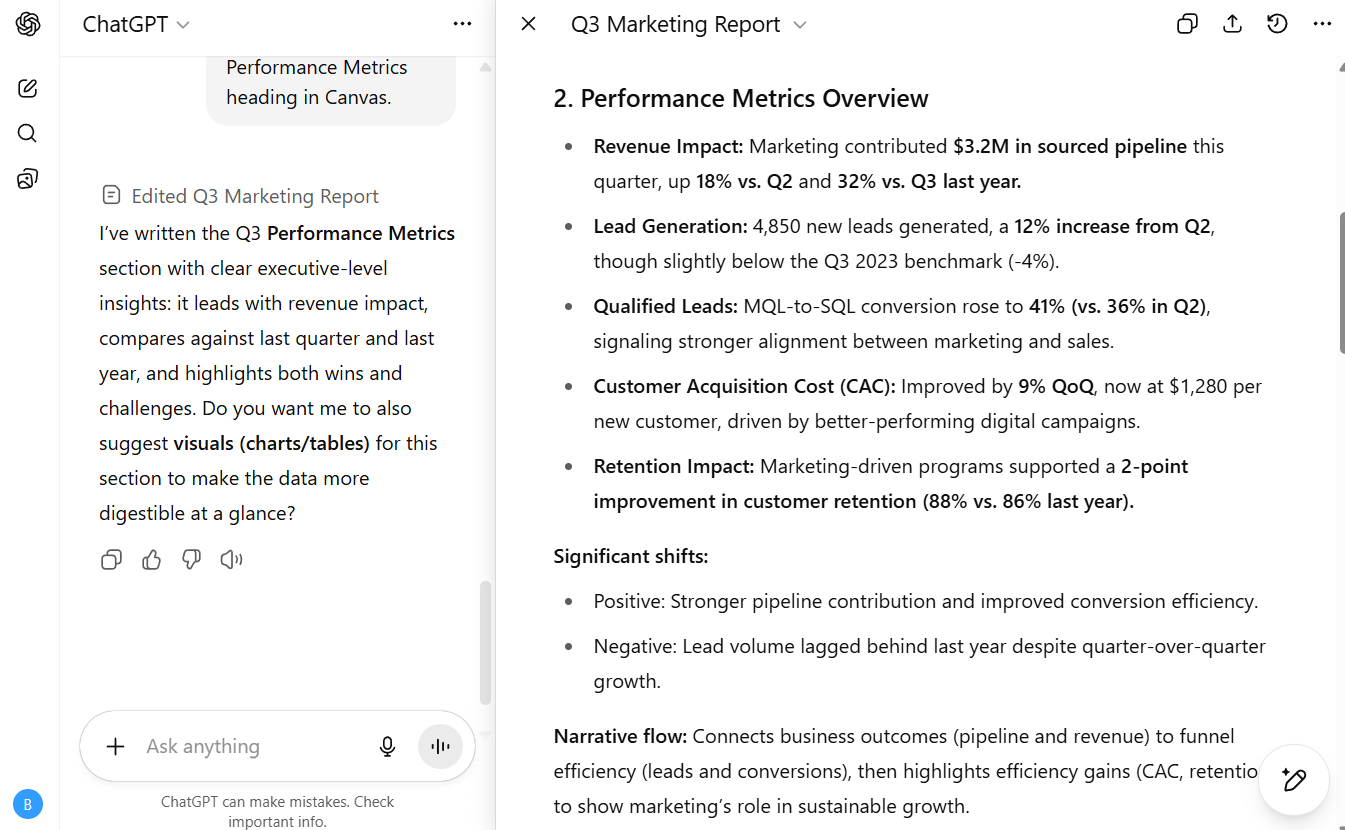
Completed section being added to the existing document structure
Repeat this for each section. Canvas keeps everything in one place, so you can see how sections fit together as you build them out.
Step 3: Edit and Refine Your Content
This is where Canvas gets really useful. You have two ways to improve your content, and both work well.
For broader changes, just describe what you want in the chat:
Prompt for targeted editing:
The "Performance Metrics" section in Canvas needs more executive appeal. Please: - Make key numbers stand out more clearly - Add brief context for what these numbers mean for the business - Reorganize metrics by importance rather than chronologically - Remove jargon that might slow down busy readers Update this section directly in Canvas while keeping the overall flow.
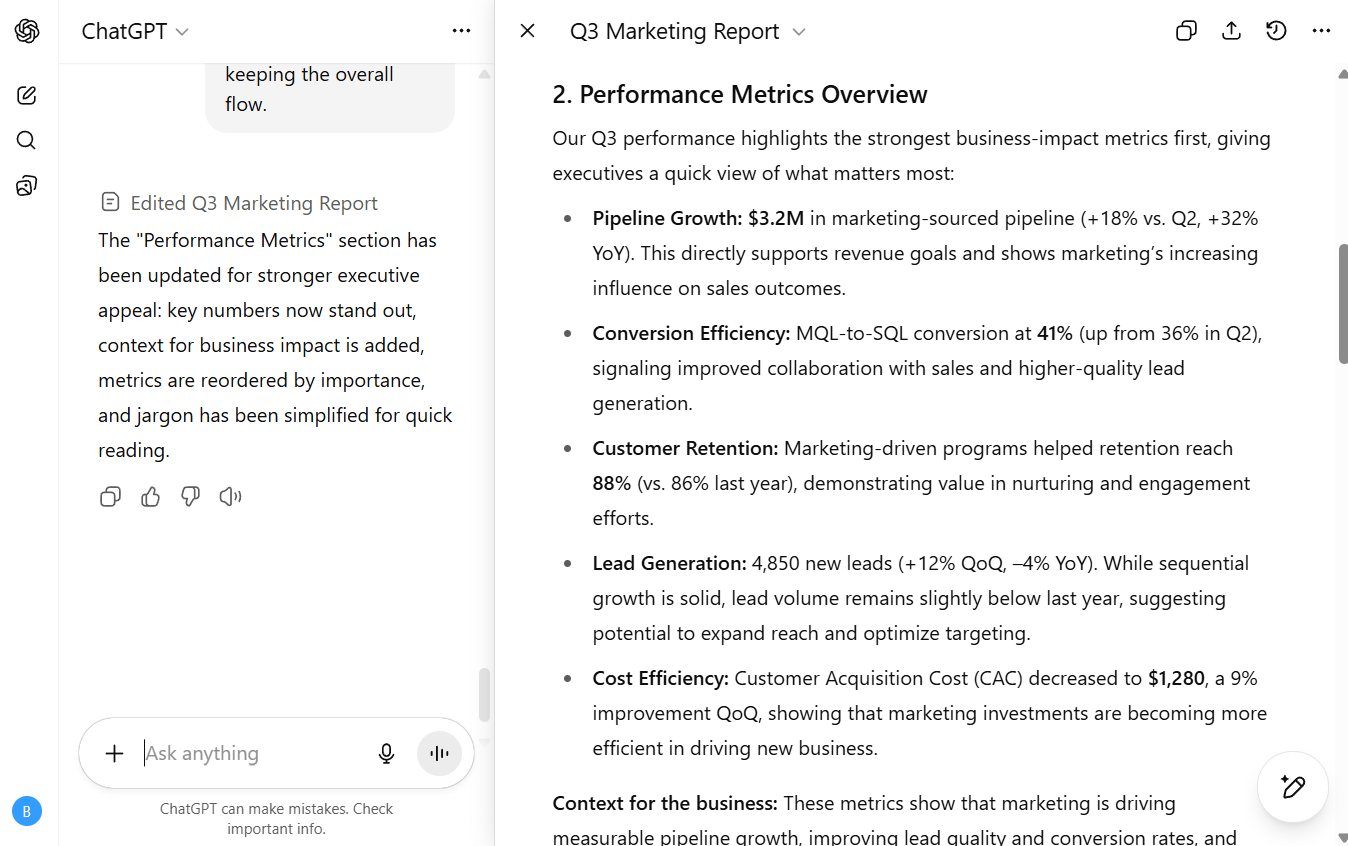
ChatGPT after updating the Canvas for targeted editing
For quick fixes, highlight any text in Canvas and you'll see options to ask ChatGPT to edit or explain that specific part. This is perfect when a sentence feels off or you want to strengthen weak language.
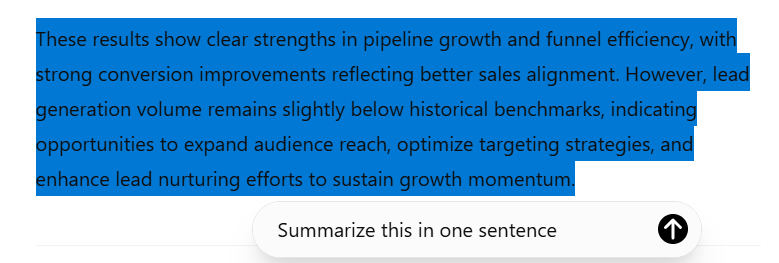
Canvas editing interface showing highlighted text to be modified
Canvas updates happen pretty quickly. You see changes as they're made and can keep iterating until each section hits the right tone and length. This editing process feels natural because you're working directly with your document rather than managing multiple versions.
Step 4: Polish for Professional Presentation
Now bring everything together into one cohesive document. This step adds smooth transitions and ensures consistent tone throughout your entire report.
Prompt:
Polish our complete quarterly marketing performance report in Canvas into a final professional document: - Add smooth transitions between sections for natural flow - Ensure consistent tone throughout (professional but accessible) - Suggest formatting improvements for headers and data presentation - Create a compelling opening paragraph that sets context - Remove any redundant information across sections - Identify where charts, graphs, or visuals would strengthen the story Update everything directly in Canvas. The final version should read as one cohesive piece.
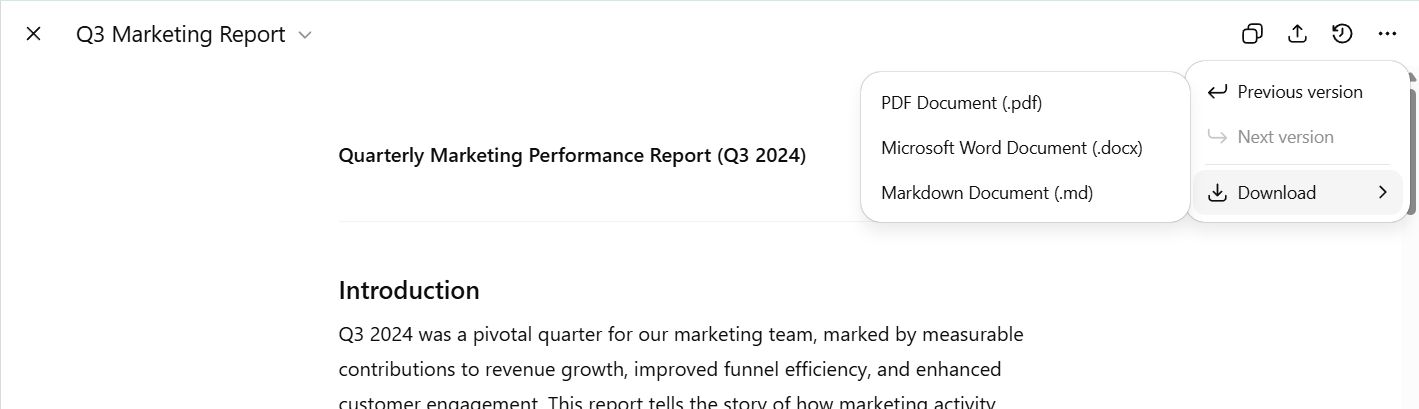
Canvas interface showing the completed report with export options visible
Canvas gives you a finished document that's ready to copy, share, or download as a .pdf, .docx, or .md file. The text part works great, and it can manage basic tables, but anything beyond that - charts, graphs, fancy visuals - you'll need to create elsewhere and drop in after export.
Speaking of transforming messy information into something useful, we run corporate training where teams learn practical AI applications like this. Your people work on real problems they're facing, not theoretical exercises. If your team talks about using AI but hasn't figured out how to make it work for daily tasks, let's chat.
Your Turn
Grab your most recent data collection; survey responses, project metrics, monthly numbers. Upload it to ChatGPT and just build the structure in Canvas. That's it.
You'll go from staring at a blank page to having a real framework in about 30 seconds. Once you see how that feels, write one section to get comfortable with the process.
Most people get stuck trying to do everything at once. Start with structure, then tackle one piece.
Want to get even more practical? Explore hands-on AI learning with AI Academy:
AI Academy Membership: Get 12 months of access to all our cohort-based programs, live webinars, on-demand courses, and tutorials.
AI Agent Bootcamp: Accelerate processes and solve business problems by mastering prompts and building AI Agents, without coding.
Corporate Training: Equip your team with the skills they need to unlock the potential of AI in your business.
Practical Introduction to ChatGPT: A free course on using ChatGPT confidently, understanding its workings, and exploring its potential.
We'll be back with more AI tips soon!


