
You keep the real numbers in a spreadsheet. The project tracker, the budget, the content calendar, the list of client sessions.
It works. Everyone knows where the file lives, and the data in it is right.
The cost shows up when the team needs to work in it rather than read it. Someone rebuilds the same view by hand every week. Or you ask for a dashboard and wait for whoever owns reporting. Or the company buys another tool, and now the data lives in two places.
Google's answer is Sheets canvas. You describe the view you want in plain language, and Gemini builds an interactive mini app on top of the rows you already have. If your company is on Business Standard or above, there is a good chance it is already sitting in your Insert menu and nobody has noticed.
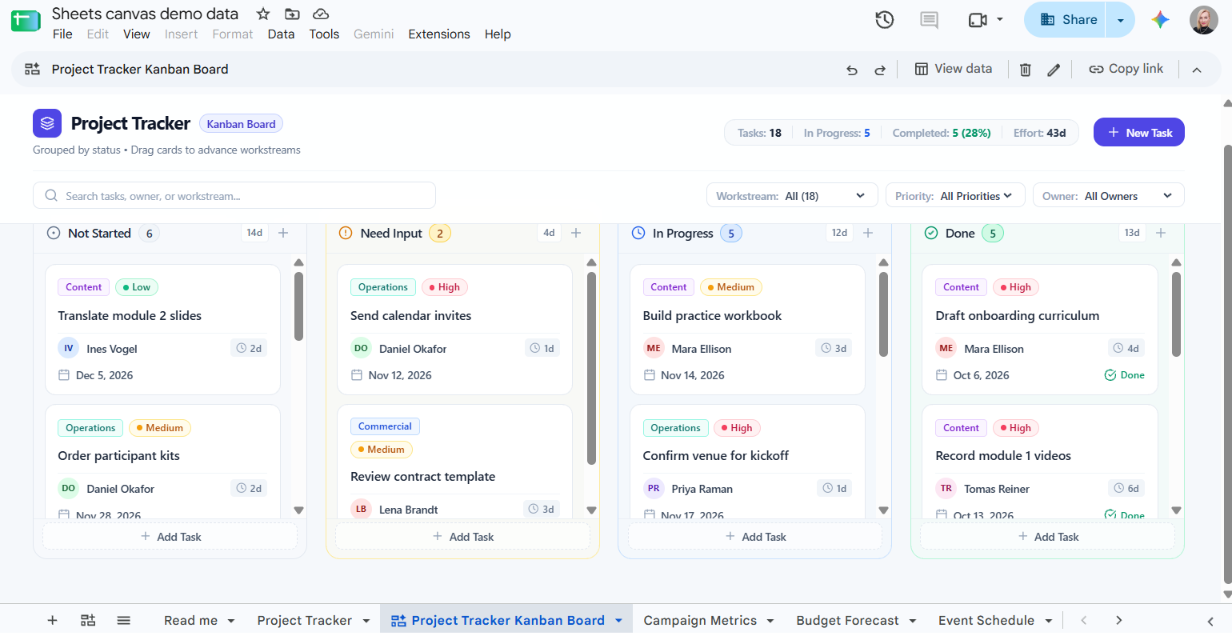
Sheets canvas is a read-write layer that sits on top of your spreadsheet data and lives as a tab inside the same file. Google describes it as a way to turn spreadsheet data into custom, interactive mini apps using natural language prompts, with no formulas or code.
Three things make it different from a chart or a dashboard template.
It writes back. Drag a task card from In Progress to Done on the canvas and the underlying cell changes. Edit the sheet and the canvas updates. The sync runs both ways in real time.
It keeps your permissions. The canvas inherits the sharing settings of the spreadsheet. People with edit access can change data through the canvas. People with view or comment access can only look.
You refine it by talking to it. If the layout is wrong, you prompt Gemini again to change the design, the grouping, or what the cards show.
Google says the feature runs on its Gemini 3.8 Flash model.
Before you start. A canvas reads from a single sheet tab, so put the data you want on one tab with a clear header row. Named columns give Gemini something to build around. Two other conditions catch people out. The file has to be a native Google Sheet in Drive rather than an uploaded Excel file, and your account language has to be set to English.
Open a Google Sheet on a computer, then use any of these three entry points.
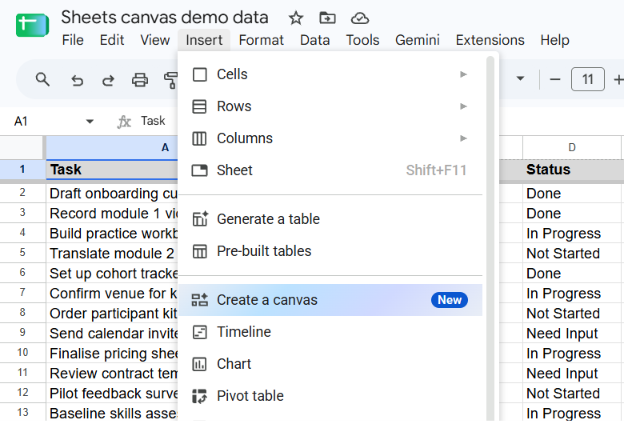
All three land in the same place. The Gemini panel opens on the right, set to build a canvas rather than answer in the panel, with a few ready-made suggestions: Create a kanban board, Create a dashboard, Create a gallery view. Nothing has been built yet. No new tab, no change to your data.
Click one of those suggestions, or type the view you want yourself. Something like "build a Kanban board grouped by status, with owner and due date on each card." Gemini works for a few seconds, then creates a new tab in the bar at the bottom of the spreadsheet, beside your existing tabs, with the canvas in it. The panel confirms what it built and asks whether you want changes. Keep prompting there until the layout is right.
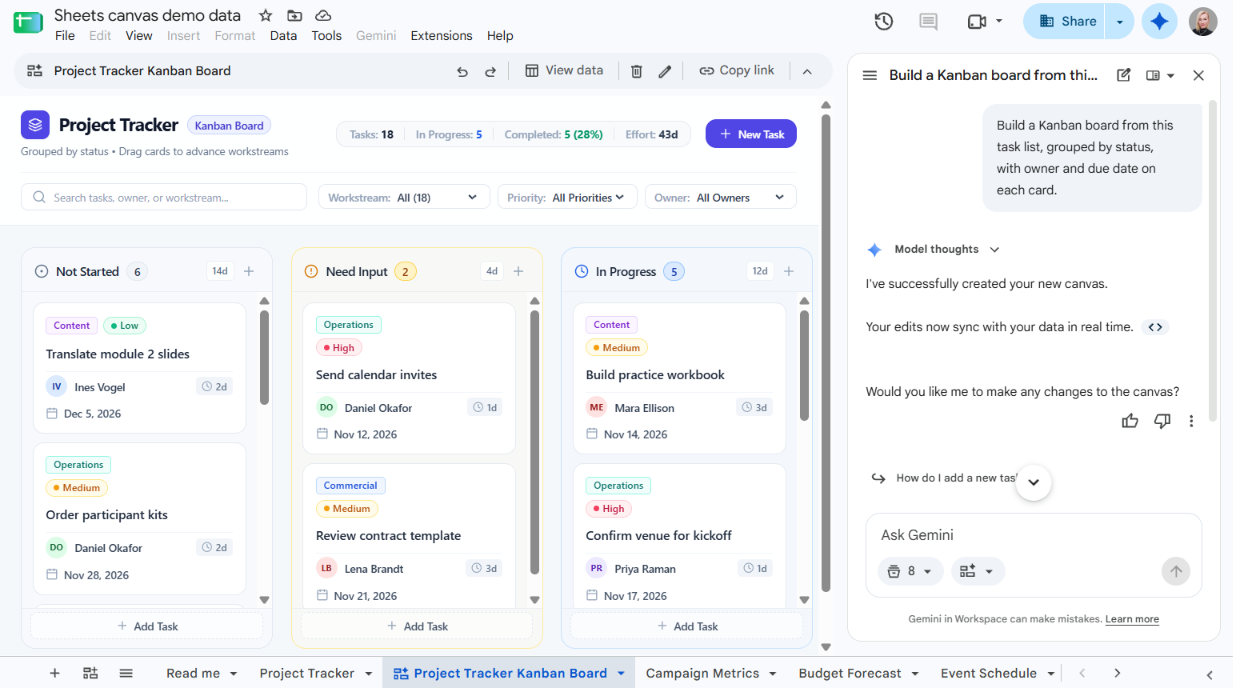
A small toolbar sits above the canvas. View data opens the rows behind it. The pencil renames the tab. Copy link gives you a link that opens the spreadsheet on this canvas, which is what you send to a colleague. The bin removes the canvas, and your rows stay in the sheet.
Google published six starting points. The Kanban board above is the first. Here are the other five, each one a job most teams already do in a spreadsheet, with an example prompt you can adapt.
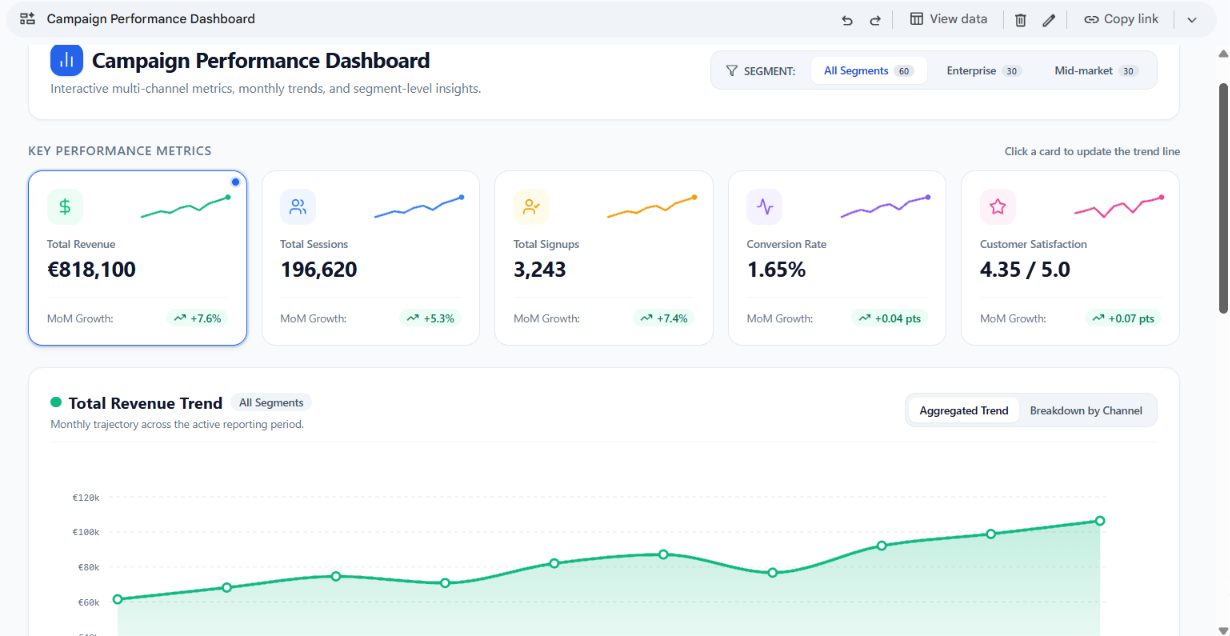
Thousands of rows of campaign results or product feedback are hard to read as a grid. A canvas turns them into scorecards, trend lines and filters. Stakeholders can filter by segment or drill into a score without asking you for a cut of the data.
Prompt to try: "Create a dashboard with scorecards for the top five metrics, a trend line by month, and a filter by customer segment."
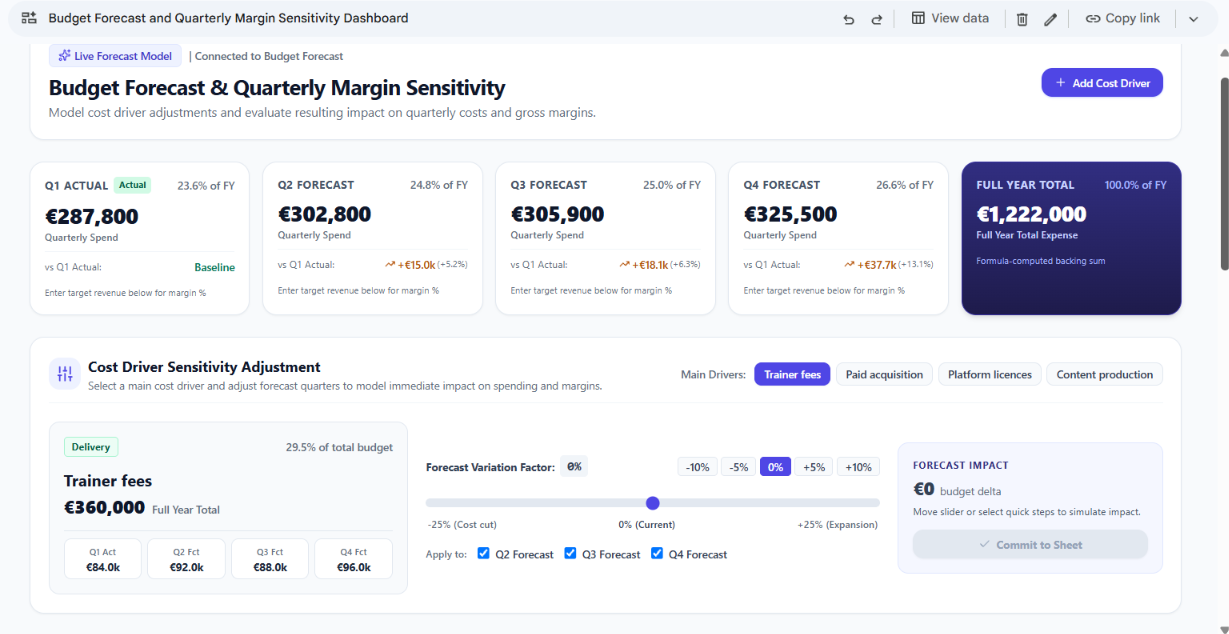
Sensitivity analysis in a grid means copying tabs and breaking formulas. A canvas gives you sliders and inputs on top of the forecast, so you can change an assumption and see the effect. The team can test scenarios together without touching the formulas underneath.
Prompt to try: "Build an interactive model from this forecast where I can adjust the main cost drivers and see the impact on quarterly margin."
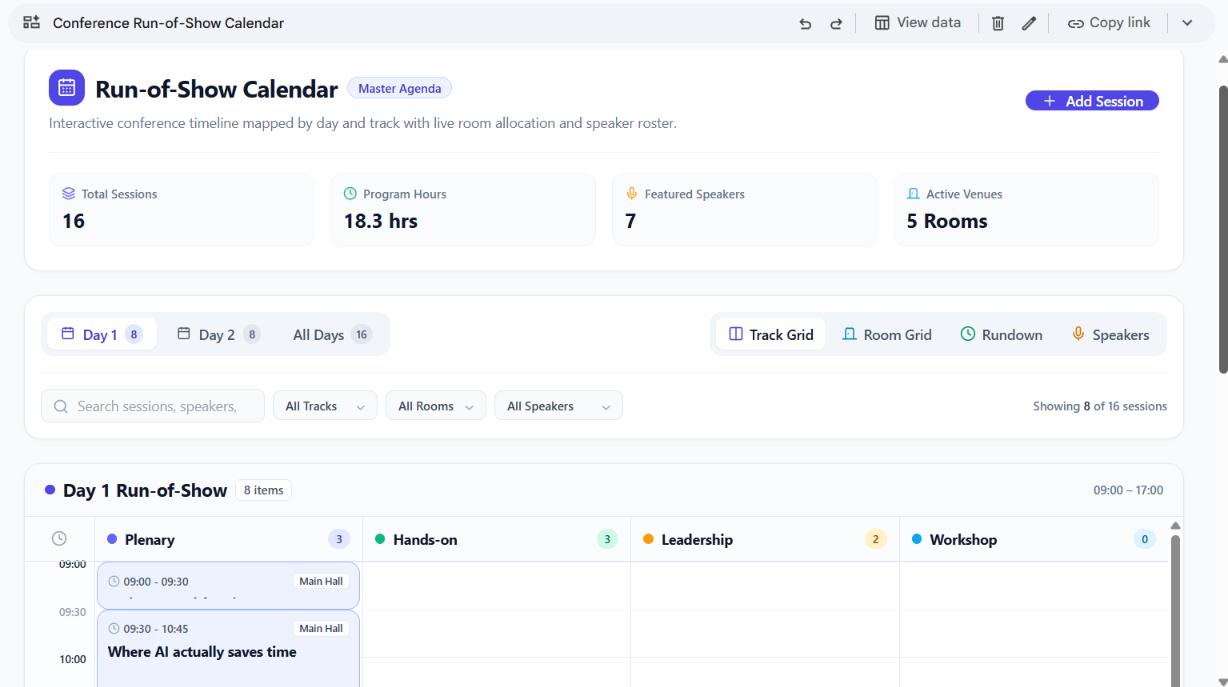
A conference agenda or launch plan has dozens of moving parts, and the gaps and overlaps are the thing you need to see. A canvas maps the rows onto a timeline or run-of-show calendar. Drag a session to move it, update room details inline, and the schedule sheet follows.
Prompt to try: "Map these agenda items onto a run-of-show calendar by day and track, showing time, room and speaker."
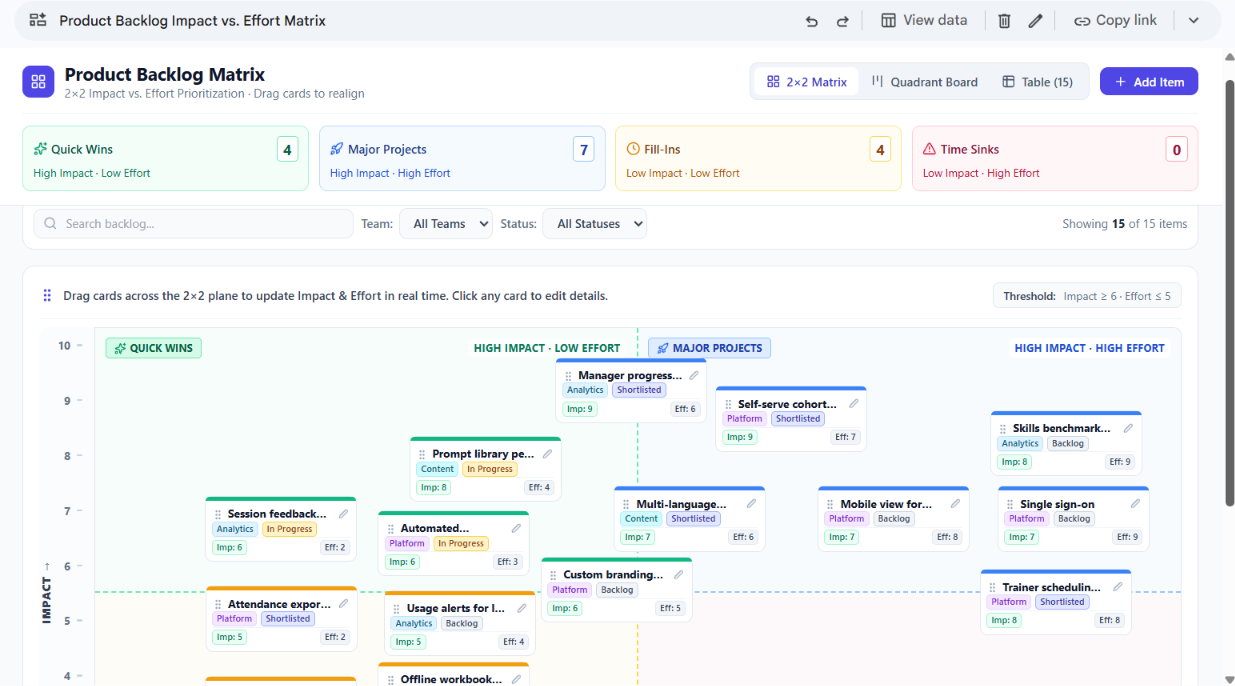
When the backlog grows, deciding what comes next gets harder. Plot items on a matrix of impact against effort. The team adjusts scores on the grid, watches items move between quadrants, and the quick wins become obvious.
Prompt to try: "Plot these backlog items on a 2x2 of impact versus effort, with a card per item I can drag."
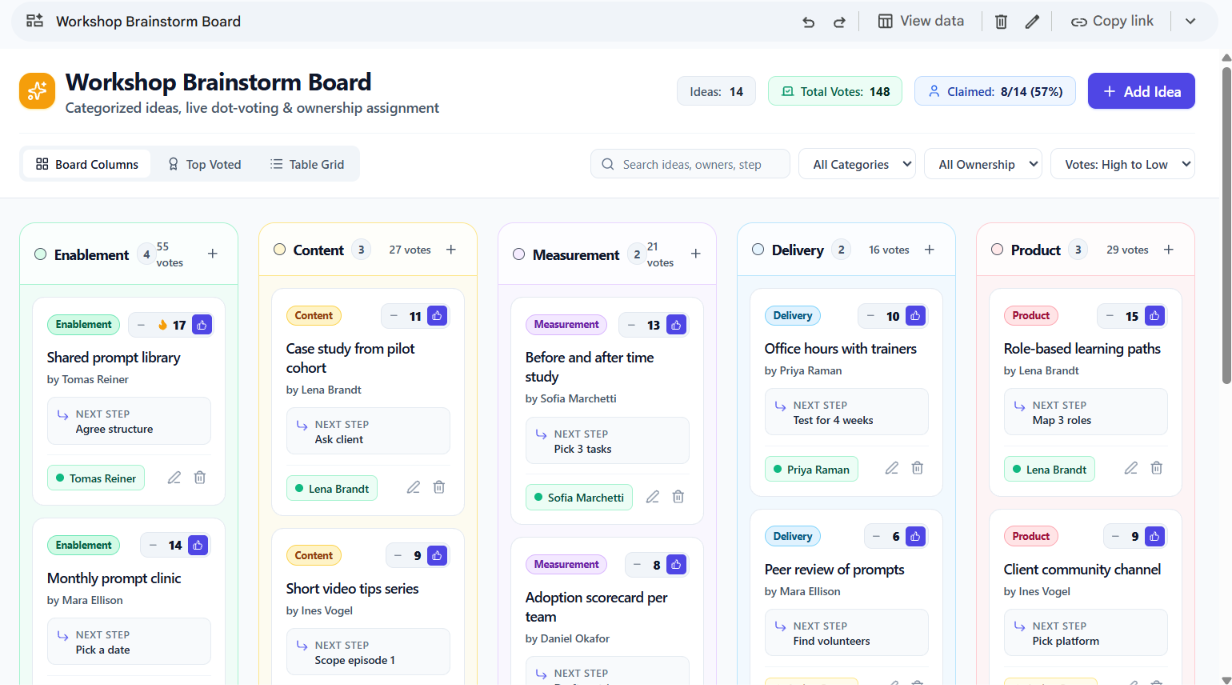
Brainstorms usually end with a list someone has to sort later. A canvas turns raw ideas into categorized cards with voting columns, so the group can upvote, group themes and assign owners while the energy is still there. Everything syncs back to the sheet.
Prompt to try: "Turn these ideas into a workshop board with categorized cards, a voting column and an owner field."
A canvas looks like an app, which is exactly why it needs a few guardrails. These are the points we raise with teams in training.
Sharing is inherited, not separate. Anyone with edit access to the spreadsheet can change data through the canvas. If the file is shared widely because people only needed to read it, the canvas now gives those same people a friendlier way to edit it. Review the sharing list before you share the canvas.
Edits are real edits. A card dragged by mistake changes a cell. The change is harder to spot than a typo in the grid, because nobody is looking at the grid. Agree on who owns the file.
Test on a copy first. Duplicate the sheet, build the canvas there, confirm the sync behaves the way you expect, then do it on the live file.
One tab means one tab. Budgets, targets or rules that live on other tabs will not be read. Consolidate first, or include those numbers in the prompt.
Check what Gemini grouped. The layout is generated from your column names and values. If a status column has inconsistent labels, the board will show inconsistent columns. Tidy the labels first and the board comes out tidy.
Treat it as a view. For anything that needs validation rules, audit trails or role-based access, a canvas is a good prototype and a poor final answer. Build it in a canvas, and if it becomes load-bearing, rebuild it properly.
Pick one spreadsheet your team opens every week. A project tracker, a pipeline, a content calendar. Copy it, put the data on a single tab, and build one canvas from it.
If you would rather not experiment on live data, you do not have to. Every screenshot in this post was built from a dummy spreadsheet we generated with AI, six tabs of invented project, budget, event and backlog data, from a single prompt. Ask any AI tool for a realistic sample sheet for your own line of work, and you have a safe place to try each of the prompts above before anyone else sees them.
Use it for two weeks before you build a second one. Watch whether people reach for the canvas instead of the grid. That habit is the only signal that tells you whether anything changed.
Access is the easy part. The value comes from teams knowing which tasks to point it at and how to check the output.
That is what AI Academy's corporate training programs are built for: hands-on sessions where people apply AI to the work they already do, with the habits that keep the output reliable.
Learn More About Corporate Training
What is Google Sheets canvas?
It is a Gemini feature that turns the data in a Google Sheet into an interactive mini app, such as a Kanban board, dashboard, calendar or priority matrix, from a plain-language prompt. The canvas lives as a tab inside the same spreadsheet.
Do I need to know formulas or code?
No. You describe the view you want and Gemini builds it. You refine it with more prompts rather than by editing formulas.
Does editing the canvas change my spreadsheet?
Yes. The canvas is a read-write layer. Moving a card or changing a value updates the underlying cell, and edits made in the grid show up in the canvas in real time.
Who can see and edit a canvas?
Whoever can see and edit the spreadsheet. The canvas inherits the file's sharing settings. People with view or comment access cannot change anything through it.
Which plans include Sheets canvas?
Google Workspace Business Standard and Plus, Enterprise Standard and Plus, the personal Google AI Pro and Ultra plans, and the Google AI Pro for Education add-on. Business Starter and free personal accounts are not included.
Why can't I see the Create canvas option?
Usually one of three reasons. Your plan is not eligible. Your admin has not enabled Gemini in Sheets. Or your account language is not set to English.
Can a canvas use data from more than one tab?
No. A canvas reads from a single sheet tab. Consolidate the data you need onto one tab, or put the extra figures in the prompt.
Does it work on mobile?
Not yet. Sheets canvas is web only at launch, and Google has not announced a date for the Sheets mobile apps.
Are there limits on how many canvases I can create?
Yes. Creating and editing canvases is subject to per-user usage limits, and Google has not published exact numbers. Source data is also capped at 1 million cells.
How does Sheets canvas compare to a real internal app?
It is a fast way to make one tab of data easier to work with, and it shares like a spreadsheet. It does not give you validation rules, audit trails or separate permissions. Use it to prototype, and move to a proper app platform if the workflow becomes critical.


